

Can we win trades during a bear market? Can we beat the market during crypto winter? I get this million-dollar question all the time, and it’s a hard subject to discuss. So I decided to publish this on social media to have other people add more value to this.
Before we begin, this is not financial advice and you must understand that trading is not investing. You might lose some or all of your money, only risk money you can afford to lose. So, let’s begin then.
Crypto market as we all know, is very volatile and a 25/7 nonstop market. And all crypto assets work cyclically depending on how Bitcoin fluctuates in the market. At this moment of writing, the crypto market can be considered bearish since Bitcoin technically fail to break the $60k level and fall into the $20k level.
Back to the million-dollar question, can we win during a bear market? YES, you can. It’s difficult, but sure you can. You need to be a sniper or a bullseye to do such a task (and not get killed in the process). This method has been tested on hundreds of trades (on live trades).
Fibonacci Retracement
If you are familiar with Fibonacci, Fibonacci numbers are a series of sequence numbers that perform golden ratios. In this case, the golden ratios are used in technical analysis to determine the key level of retrace (correction) and decide the key support.
I always use Tradingview and my setup for Fibonacci Retracement is on 38.2%, 61.8%, and 78.6% levels. For volatile assets such as crypto, you need to have a longer timeframe such as Daily or Weekly. See the charts below:
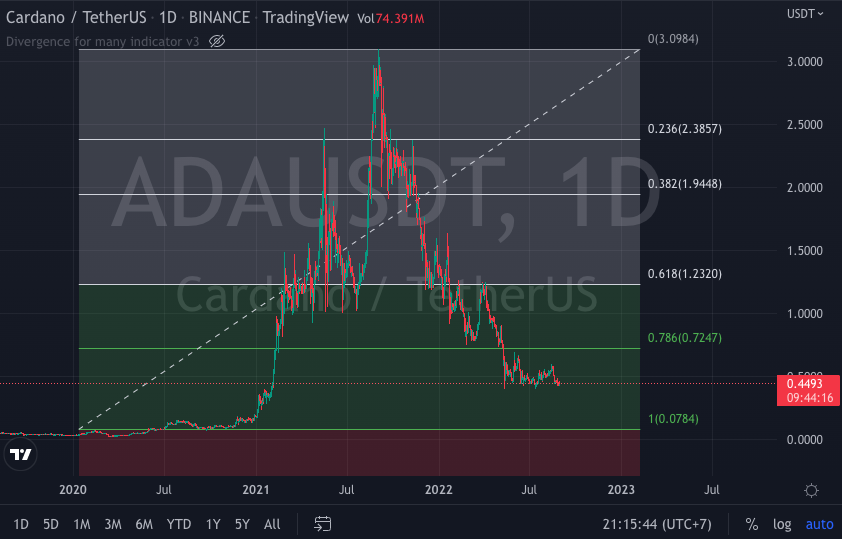
The daily chart on ADA/USDT
Drag the Fibonacci Retracement tools with 100% level as the baseline, and 0% as the All-Time-High (ATH) price. To be precise you can set it on logarithmic mode and set the baseline. The level of 61.8% and 78.6% can be considered as strong support before the candle bounce back and make the bull run.
Divergence Pattern
What is divergence? Divergence is when the price of an asset is moving in the opposite direction of a technical indicator, such as an oscillator or momentum, or is moving contrary to other data. Divergence warns that the current price trend may be weakening, and in some cases may lead to the price changing direction.
Divergence is very good to spot on reversal patterns. See the charts below for S&P500:
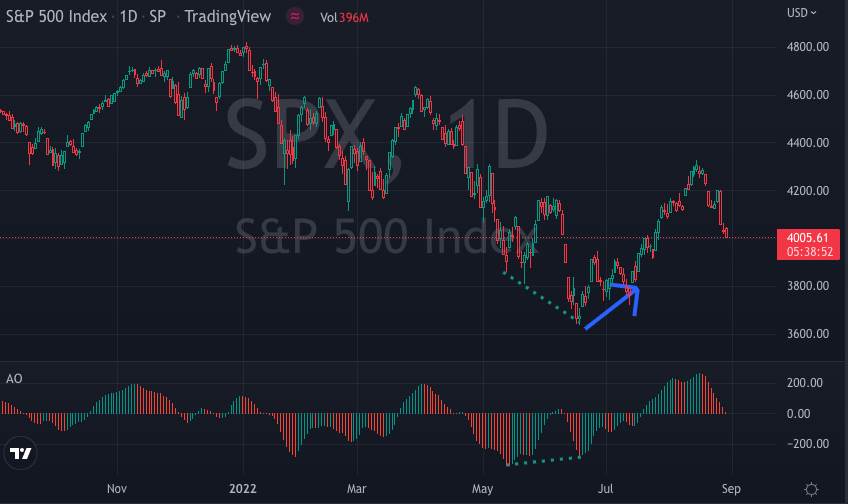
The daily chart on S&P 500
From the charts, we can see the price is pushing a lower low, from 4400-4200- 3800-3700, but on the contrary, the indicator (Awesome Oscillator) is moving higher low (see the dotted lines). This means the price is dumping and the momentum is weakening. It’s an early signal of reversal! This early confirmation indicates a bullish reversal pattern, which we often call Bullish (Regular) Divergence.
This can work perfectly with any indicator such as RSI, Stochastic Oscillator, MACD, Money Flow Index, and so on. The cheat sheet is as follows:
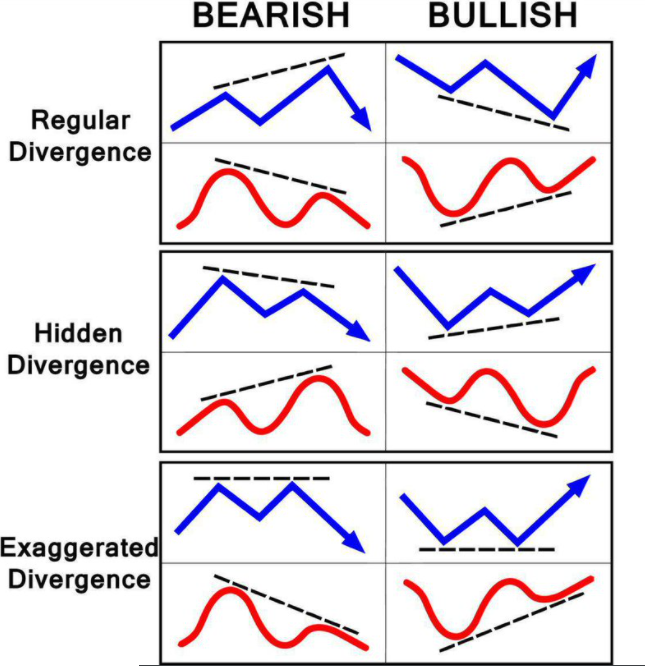
Divergence Pattern Cheat Sheet
Timing is The Most Important
We got Fibonacci Retracement and Divergence Pattern for the combination. The final step is TIMING. Timing is the winning factor to complete all the processes.
If we look into most of the crypto charts during this bear season, most of them have already passed the Fibonacci Retracement 61.8% — 78.6%. The question is should we enter the market already? You need to check first the Divergence Pattern, especially for the Bullish Divergence on Daily or Weekly. A shorter timeframe will produce many false signals, therefore your trades will not be optimum. With current conditions, it will be approximately months before the bullish divergence forms. So, time is important. You don’t want to waste your bullet early for the unnecessary kill, do you?
Finally, if all conditions are met, then you are ready to pull the trigger! HAPPY TRADING!