

Kaspa Price Prediction: Is an Uptrend Finally on the Horizon?
Kaspa (KAS) has been making waves in the cryptocurrency space, thanks to its unique approach and recent price movements. This article delves into Kaspa’s price performance, key technical indicators, and factors to watch out for—whether bullish or bearish.
Current Kaspa Price Performance
Recent Price Movements
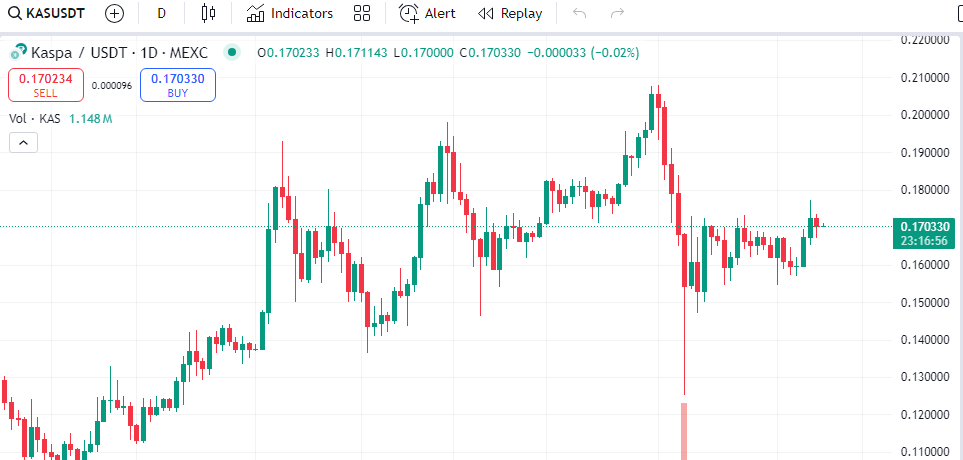
Kaspa, a relatively new cryptocurrency, has shown significant volatility in its price behavior. In recent months, KAS has experienced peaks and dips due to investor enthusiasm and market corrections. Kaspa trades between $0.10 and $0.30 per coin, with occasional spikes. These movements indicate a tug-of-war between bullish and bearish forces.
Despite this volatility, retail investors buy, even as large holders sell off at new highs. A key bullish indicator is the formation of higher lows, suggesting potential upward momentum.
Market Sentiment and News Impact
Investor sentiment plays a critical role in cryptocurrency price movements. For Kaspa, recent developments have generated cautious optimism among crypto enthusiasts. Factors such as strategic partnerships, technological upgrades, and increased adoption can boost investor confidence and drive demand. Conversely, negative news or regulatory concerns can lead to price declines. Keeping an eye on market sentiment and news will be crucial for understanding Kaspa’s potential upside.
Technical Analysis
Moving Averages
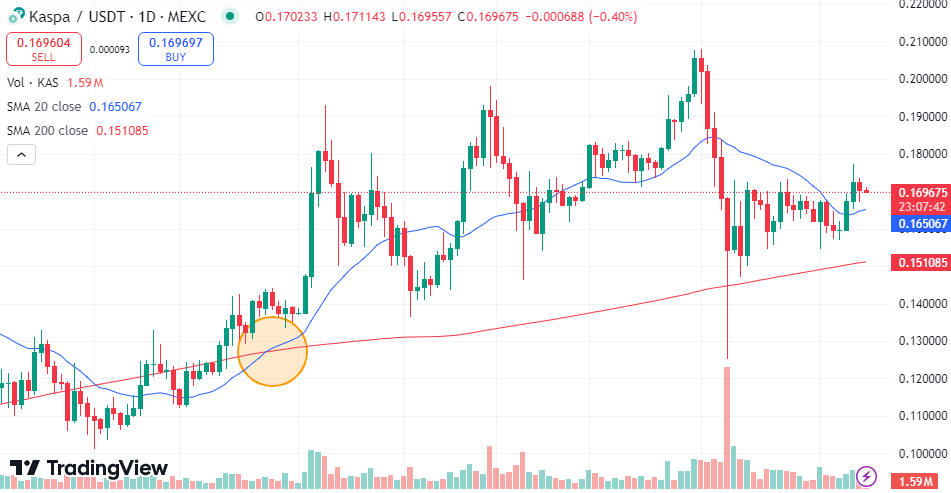
Moving averages are fundamental tools for analyzing trends. Kaspa’s recent short-term moving averages (e.g., 20-day and 50-day) crossing above longer-term averages (e.g., 100-day and 200-day) indicates a bullish signal known as a “golden cross.” This suggests that recent uptrends might continue. Traders should confirm this signal with other technical indicators to avoid false positives.
Relative Strength Index (RSI)
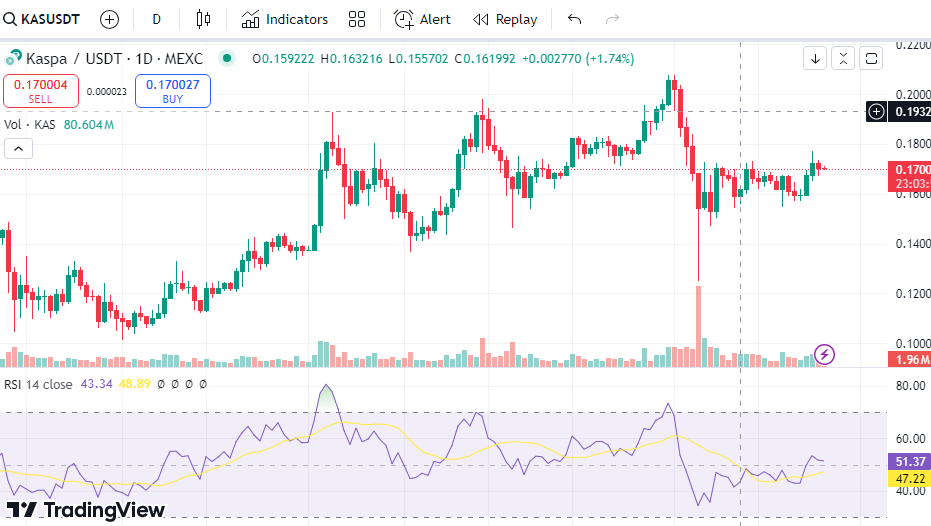
The RSI is useful for identifying overbought or oversold conditions. Currently, Kaspa’s RSI is around 51, indicating it is approaching overbought territory but not yet signaling a reversal. An RSI above 70 would suggest overbought conditions, potentially leading to a correction. Traders should monitor the RSI closely to gauge the strength of the current uptrend.
MACD (Moving Average Convergence Divergence)
The MACD is another vital tool for trend analysis. On Kaspa’s daily chart, the MACD line crossing above the signal line suggests that buying pressure is building, which could lead to higher prices. If the MACD line stays above the signal line, it indicates a bullish trend. However, if it turns downward below the signal line, this could signal weakening strength or a potential reversal.
Potential Buy Points
Support Levels
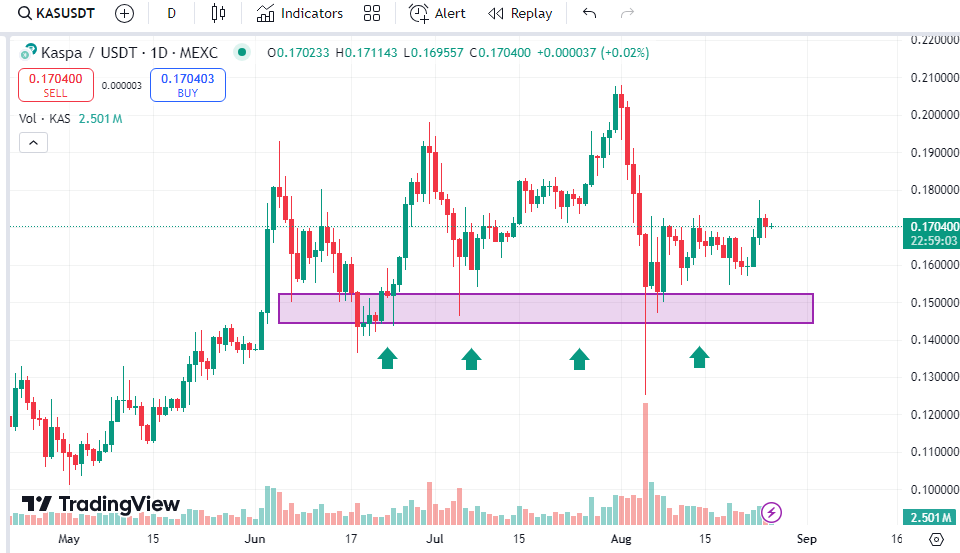
Support levels are crucial for identifying potential buying opportunities. Kaspa has found support around $0.15. If the price remains above this level and shows signs of rebounding, it could indicate strong buying interest and a potential uptrend. Traders should look for confirmation of support through consolidation patterns or bullish price action.
Breakout Above Resistance
Resistance levels are important for identifying long-term buying opportunities. Kaspa has faced resistance at the $0.20 level. A break above this level could trigger a fresh rally. Traders could enter a long position upon a clean breakout above $0.20, with the potential for further gains. A sustained move above $0.30 could lead to new all-time highs.
Retracement Levels
Fibonacci retracement levels can help identify potential buy entries during corrections. If Kaspa retraces to key Fibonacci levels (e.g., 38.2% or 50%) and shows signs of holding, it could present a buying opportunity. Traders should watch price action around these levels for potential support and buying signals.
Potential Sell Points
Resistance Levels
Resistance levels such as $0.20 are important for identifying potential selling opportunities. If Kaspa reaches this level, it may be a good time to take profits or sell. Traders should be cautious of price action approaching significant resistance levels.
Overbought Conditions
Monitoring the RSI for overbought conditions can help identify potential sell points. An RSI above 70 suggests overbought conditions, indicating a possible correction. Traders should consider taking profits or reducing positions when the RSI nears overbought levels.
Trend Reversal Indicators
Bearish candlestick patterns or a downward MACD crossover can indicate trend reversals. Traders should look out for these signals to make informed decisions about exiting positions or adjusting their strategy.
Risk Management
Setting Stop-Loss Orders
Stop-loss orders can help protect against significant losses. Setting stop-losses below entry points can limit downside risk. Traders should establish stop-loss levels based on their risk tolerance and market conditions.
Using Position Sizing
Proper position sizing is essential for effective risk management. Traders should determine the size of their trades based on their risk tolerance and market volatility, ensuring they don’t risk more than they can afford to lose.
Diversifying Your Portfolio
Diversification is key to spreading risk. Traders should avoid investing solely in one asset and instead allocate capital to other cryptocurrencies or traditional investments. A diversified portfolio can help mitigate the impact of adverse price movements.
Conclusion
Traders should monitor key levels, such as support at $0.15 and resistance at $0.20, to make informed buying and selling decisions. While indicators suggest a potential uptrend, it’s important to remember that cryptocurrency markets are highly volatile. Conduct thorough research, manage risk, and consult with professionals before making trading decisions. Kaspa offers opportunities for those who analyze and plan accordingly.