Bitcoin’s performance of 2023 has left the market and Bitcoin enthusiasts on a winning spree. However, as per additional information, Bitcoin could only be commencing its bull rally of 2023 and there’s more to come.
- Bitcoin’s reserve risk indicator suggests that the market is on its long-term bullish recovery trend.
- The bullish expectations align with Bitcoin’s pricing model.
So far, opinions on Bitcoin’s bullish 2023 performance have been divided. There are two main groups: the hard bulls who think that current rally is the beginning of the next major bull run and the doubters who predict at least one more significant downturn before the big rip.
So, which group is correct? Well, the historical data stored on-chain may make the solution easier to find than anticipated. The position of Bitcoin can be estimated with some degree of precision using several on-chain historical data. One of them, the Reserve Risk Indicator (RRI), is arguably the most overlooked.
The RRI, according to Glassnode, is a cyclical indicator that shows how the risk-reward ratio of an asset compares to investor conviction and confidence. It is the best predictor for the long term. What, then, makes this indicator so unique?
Historical trend timing accuracy of the RRI
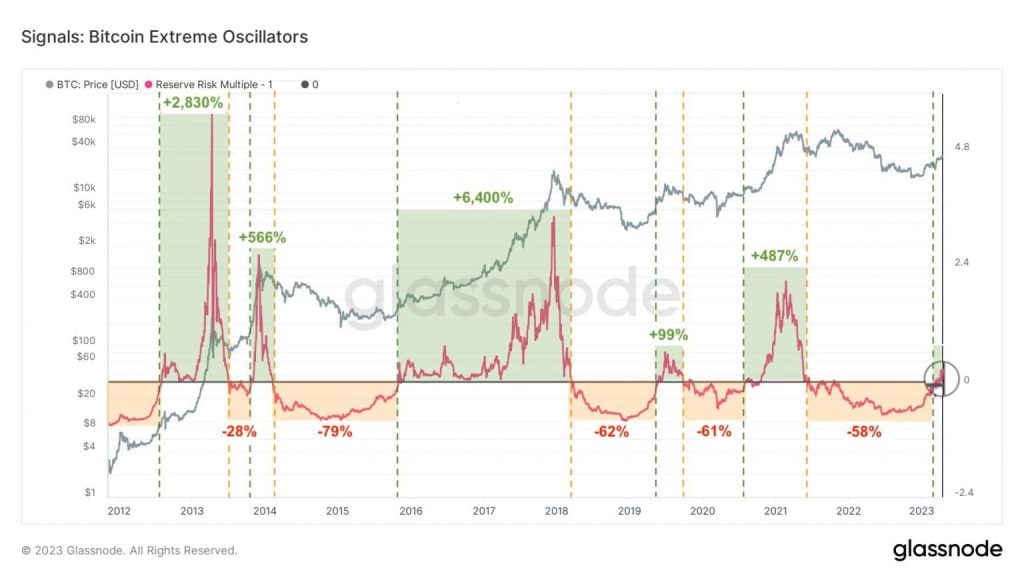
The RRI oscillates on a neutral line, and crosses on this line have great significance. For instance, after breaking the 0 line in 2013, 566% in 2014, 6,400% in 2017, 99% in 2019, and 487% in 2021, the price of Bitcoin increased by 2,830%.

In cases when it experienced strong sell pressure after crossing below the 0 line, the inverse is also true. In 2015, bitcoin fell by 79%; in 2019, 62%; in 2020, 61%; and in 2022, 58%. Remember that each crossing has a reading.
One can presume that each crossover verified a directional breakout or breakdown based on past performance. This is significant because the 2023 rise for Bitcoin recently crossed the 0 line. As a result, Bitcoin owners should anticipate a significant increase over the coming several months.
How significant will the rally be in 2023?
Owners of Bitcoin should be aware that a significant rally is not always assured, especially in the short term. An perfect illustration would be the 2019 crossing, which saw a 99% gain yet is a little underwhelming for Bitcoin. Another instance when the mega pump arrived more than 12 months after passing the 0 line is the crossover in 2016.
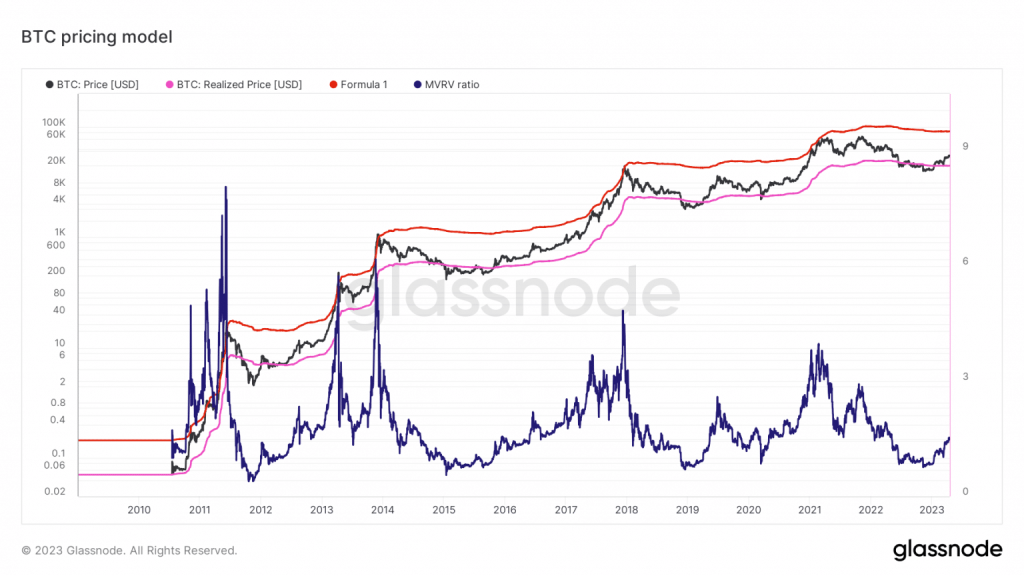
The good news is that we can use additional models to confirm the aforementioned findings. For instance, the pricing model for Bitcoin has traditionally indicated a significant rally following a price recovery back above the realized price level.

Bitcoin surpassed its realized price of $19,714 in January. The time since then has just been a few months. The two charts indicated that there was a general expectation of future gains that was positive, and that anticipation has already begun with the current gains.
Despite this, there was still a non-zero possibility that a black swan could trigger a significant and unexpected selloff. The rally could, however, be sped up by an unexpected white swan.


