

As of 3:00 AM EST, the price of Bitcoin was trading at $52,618, marking a 15% decline over the last 24 hours.
Data from VoskCoin reveals that Bitcoin (BTC) fell from a high of $65,557 on August 1, shedding over 25% of its value to reach an intraday low of $49,050 on August 5. This drop has resulted in a significant daily candle, extending the losses observed during the early Tokyo trading session on April 18.
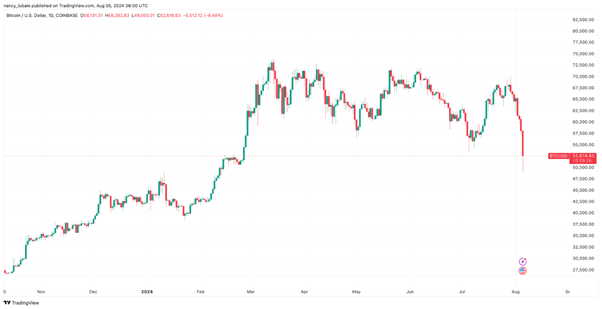
TradingView Chart: BTC/USD 1-day
The last time Bitcoin traded below $50,000 was nearly six months ago on February 14.
Accompanying Bitcoin’s performance are substantial liquidations across the crypto market. According to Coinglass, over $1.06 billion in leveraged crypto positions have been liquidated in the past 24 hours, with $666 million liquidated in the last 12 hours alone.
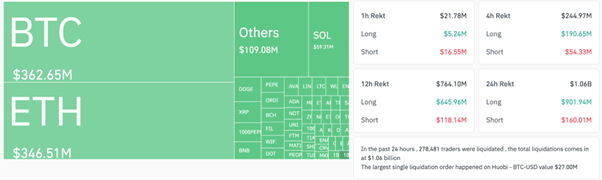
Source: Coinglass
Long Bitcoin liquidations totaled $302.57 million, with the tally continuing at the time of publication.
This suggests that short traders were caught off-guard by Bitcoin’s drop to $49,000. The largest single liquidation order occurred on the Huobi crypto exchange, involving a BTC/USD pair worth $27 million.
Is the Bitcoin Uptrend Over?
Bitcoin has formed a descending parallel channel on the weekly chart, as illustrated below. The drop below $53,000 has caused the asset to break down from this bearish chart pattern, confirming a downward breakout.
A daily candlestick close above the lower boundary of the prevailing chart pattern at $54,860 could push Bitcoin toward the $60,000 psychological level and then to the middle boundary of the channel at $61,980.
If Bitcoin surpasses this level, bullish momentum could drive the price higher to challenge resistance from the upper boundary of the chart at $69,430, which coincides with the 2021 all-time high. Such a move would represent a 31% increase from the current price.

Soure: TradingView
On the downside, the Relative Strength Index (RSI) indicates that the downtrend may continue as it remains far from overbought conditions. The RSI has dropped from 60 to 42 over the last two weeks, suggesting that sellers have regained control of the market.
Therefore, a daily candlestick close below $50,000 would signal the buyers’ inability to defend this level. In this scenario, the BTC price could decline toward the 100-week EMA at $44,517 and subsequently to the 200-week EMA at $36,000.