
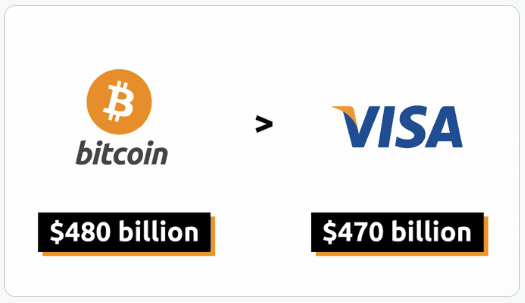
Bitcoin, the world’s leading cryptocurrency, has achieved a remarkable milestone by surpassing Visa in annual transaction volume. This feat is a testament to the growing influence of decentralized networks, but it comes with nuances that must be carefully considered. While this development is undoubtedly significant, it is essential to examine the intricacies surrounding Bitcoin’s transaction volume and the broader implications for the financial landscape.
Navigating Bitcoin’s Technical Landscape
The cryptocurrency market is abuzz with anticipation as Bitcoin (BTC) charts a path through a crucial technical landscape. At press time, Bitcoin’s price was trading above the 9-day and 20-day Exponential Moving Average (EMA) lines, setting the stage for a potentially significant move.
However, as with any market, there are two sides to the story. A failure to maintain its position above the 9-day EMA line, currently positioned around $26,356.84, could expose Bitcoin to potential risks. The next 24-48 hours are expected to be particularly decisive, as a significant bullish technical flag has recently been triggered.
Understanding Transaction Volume
At first glance, Bitcoin outpacing Visa in transaction volume seems like a cause for celebration in the cryptocurrency world. However, we must dissect what this metric truly signifies. Transaction volume, in the context of Bitcoin, can be misleading. A substantial portion of the network activity in the past year has been driven by Ordinals. This protocol allows for unique identifiers to be assigned to satoshis (the smallest unit of Bitcoin) on the blockchain, enabling transactions with additional data, such as images. These high-frequency transactions do contribute to the volume but are not necessarily indicative of widespread retail use or adoption.
Comparing Apples to Oranges
One must exercise caution when comparing Bitcoin to traditional payment systems like Visa. Notably, Visa is a centralized payment network that has been refined over decades for consumer transactions, while Bitcoin operates on a decentralized blockchain. This fundamental difference in structure is reflected in their use cases, limitations, and the nature of transactions.
Visa transactions primarily involve everyday consumer purchases, from groceries to online shopping. On the other hand, Bitcoin transactions can represent a wide spectrum of activities, ranging from buying a cup of coffee to transferring multimillion-dollar assets. Bitcoin’s versatility, while impressive, makes it challenging to draw direct comparisons to a centralized payment system designed for consumer convenience.
The Decentralized Revolution
Despite these complexities, Bitcoin’s achievement in surpassing Visa’s transaction volume is undeniably a momentous occasion. It underscores the growing prominence of decentralized networks in the world of finance and raises intriguing questions about the future financial landscape.
Could decentralized networks, such as cryptocurrencies, ultimately become the norm, rendering centralized systems obsolete? While this possibility excites cryptocurrency enthusiasts and advocates for financial inclusivity, the path to full adoption of decentralized payments is not without its challenges.
Challenges on the Road to Decentralization
El Salvador’s experiment with Bitcoin as legal tender has highlighted several weaknesses and issues that the general population may face when interacting with digital payments. The country’s rollout faced technical difficulties, regulatory concerns, and public skepticism. This case illustrates that while decentralized networks hold promise, they must overcome hurdles related to infrastructure, education, and public acceptance.
BTC Stabilizes Around $26,500 as Community Awaits FOMC’s Decision
Bitcoin experienced a week of mixed fortunes as it reached new highs in September before settling around the $26,500 mark by the end of the past week. This price movement highlighted the cryptocurrency’s resilience in the face of changing market conditions.
At its peak earlier in the week, Bitcoin touched $26,880, marking the highest level it had reached in the month of September. However, as the week progressed, the market entered a period of consolidation.
Popular trader and analyst CrediBULL Crypto pointed out that the market exhibited signs of seller absorption, indicating a defense of the $26,500 level. This bid liquidity, present in the Binance BTC/USD order book, played a role in maintaining Bitcoin’s price stability.
Crypto Tony, another trader, outlined two potential scenarios, with both of them suggesting that the $26,000 level was acting as strong support. He anticipated a dip to around $26,100, followed by a bounce that could serve as a trigger for long positions.
As the week drew to a close, the cryptocurrency market’s attention shifted to a significant macroeconomic event—the United States Federal Reserve’s Federal Open Market Committee (FOMC) meeting scheduled for September 20, 2023. During this meeting, the FOMC is set to decide on benchmark interest rates, with market expectations leaning heavily towards rates remaining unchanged.
Bitcoin, which had previously exhibited kneejerk reactions to macroeconomic data releases, appeared to have cooled its responses. Some market participants believed that Bitcoin would continue to trade within the range of $25,000 to $27,000 in the short term, despite potential volatility induced by the FOMC meeting.
Crypto Santa, a well-known trader, also expressed this sentiment, suggesting that while the FOMC meeting could introduce some market volatility, Bitcoin was likely to maintain its recent price range. This outlook indicated that Bitcoin was becoming less sensitive to traditional economic events, further reinforcing its status as a mature asset class.
Price Overview
From a price perspective, the cryptocurrency price tracking website CoinStats indicated that BTC was trading at $26,618.35 at press time. This was after it had achieved a 24-hour gain of 0.28%. In addition to the positive daily performance, the leading cryptocurrency’s price was also in the green on the weekly timeframe, with the latest increase in price taking the total weekly gain to +3.25%.
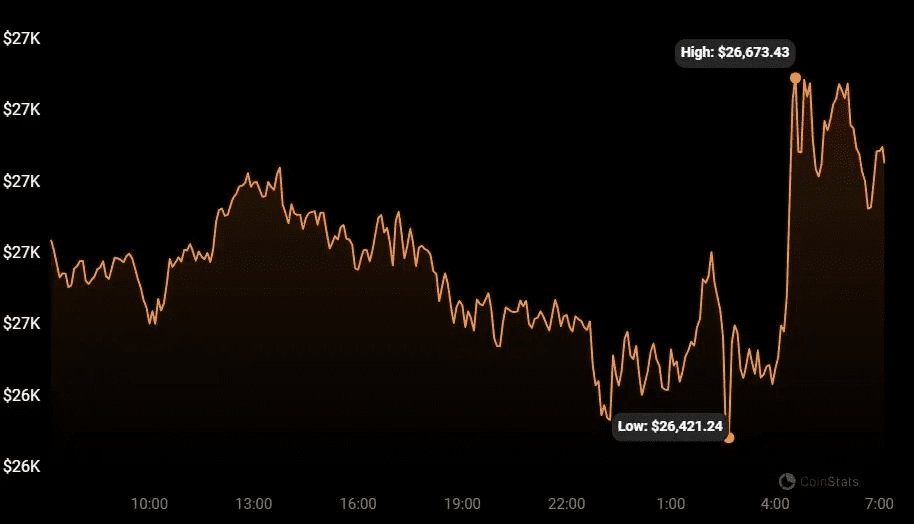
Price chart for BTC (Source: CoinStats)
BTC had, however, pulled back slightly from its daily high of $26,673.43. Nevertheless, it was still trading closer to this peak than its 24-hour low, which sat at $26,412.24. Interestingly, the cryptocurrency’s yearly performance was well in the green zone as well, and stood at +32%.
Technical Overview
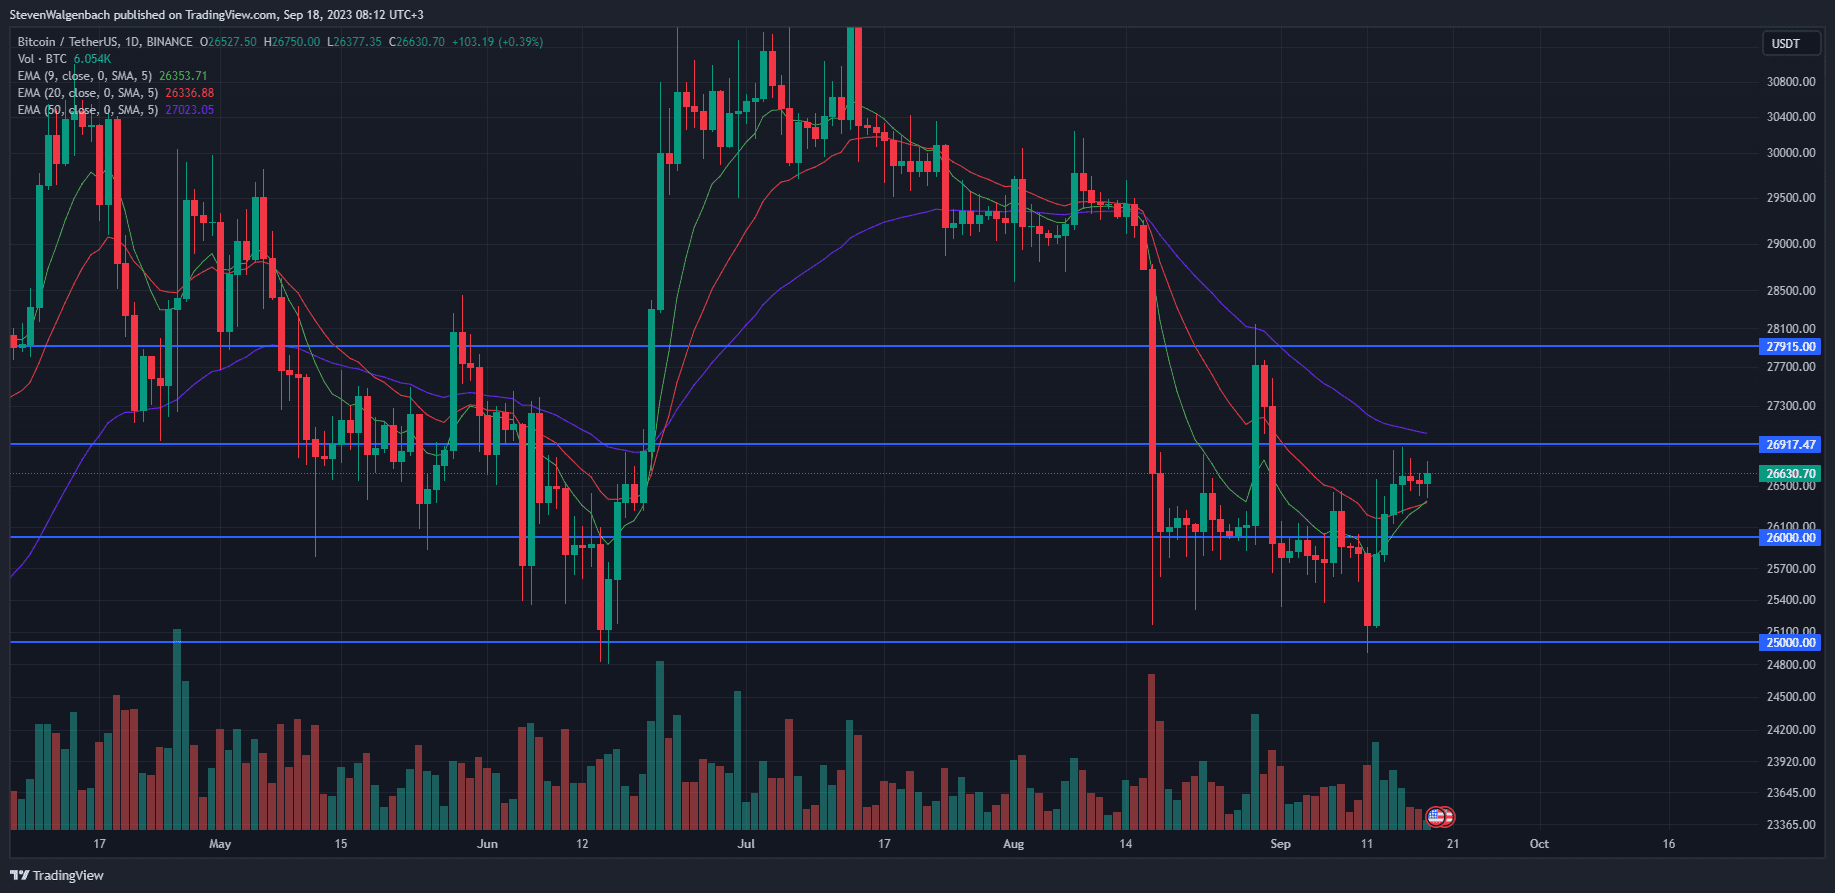
Daily chart for BTC/USDT (Source: TradingView)
From a technical standpoint, BTC’s price was trading above the 9-day and 20-day EMA lines at press time. Subsequently, the market leader’s price was attempting to break above the next resistance level at $26,917.47, which was also confluent with the 50-day EMA line. A break above this level will clear a path for the cryptocurrency’s price to continue to climb to $27,915 in the following few days.
On the other hand, BTC’s price dropping below the 9-day EMA line, which was situated at around $26,356.84, will put the cryptocurrency at risk of retesting the immediate support level at $26K. Thereafter, continued sell pressure may force BTC’s price down to $25K within the coming 2 weeks.
A bullish move is more likely to play out in the next 24-48 hours, however, as a significant bullish technical flag had recently triggered. Over the past 24 hours, the 9-day EMA line crossed above the 20-day EMA line. This signaled that short-term momentum had shifted in favor of buyers throughout the past day of trading. As a result, BTC’s price may climb in the coming 2 days. If this technical flag is validated, then the market leader’s price may have the momentum needed to flip the previously-mentioned resistance level at $26,917.47 into support before the end of the week.