
Breakdown of Fear and Greed Index in the Cryptocurrency Market
The cryptocurrency market is extremely volatile, often leading investors to make emotional decisions. These emotional responses can significantly impact investment outcomes, whether it’s the rush to buy more when prices rise or the panic to sell assets during a downturn. A tool designed to measure these emotional swings in the market is the Fear and Greed Index a simple yet powerful metric that helps investors make more informed decisions.
The Origin of the Fear and Greed Index
The Fear and Greed Index was initially developed by CNN Money for the stock market. It was designed to measure the two primary emotions — fear and greed — that are believed to influence investor behavior and, consequently, stock prices. The index combines seven different factors to measure these sentiments, rating investor sentiment on a scale from 0 to 100. This score provides insight into whether the stock market is likely to be overvalued due to excessive greed or undervalued due to heightened fear.
Adapting the Fear and Greed Index to Cryptocurrency
Recognizing the relevance of this concept to the highly volatile cryptocurrency markets, Alternative. I adapted the Fear and Greed Index specifically for Bitcoin. This cryptocurrency-specific index operates on the same fundamentals as the original but uses different indicators to capture market sentiment. Like the original, the Cryptocurrency Fear and Greed Index rates investor sentiment on a scale of 0 to 100, with lower numbers indicating extreme fear and higher numbers reflecting extreme greed.
Components of the Cryptocurrency Fear and Greed Index
The Fear and Greed Index for cryptocurrencies, especially Bitcoin, includes six key indicators that measure different aspects of market sentiment. Unlike the CNN Money Index, these indicators are not equally weighted, reflecting their varying levels of influence on the overall sentiment of the cryptocurrency market.
1. Volatility (25% of Index Value)
Volatility is essential in evaluating the level of fear in the market. This metric looks at the current price of Bitcoin and compares it to recent price movements over the past 30 to 90 days. A sharp increase in volatility is often seen as a sign of fear in the market, indicating uncertainty and instability.
2. Market Momentum/Volume (25% of Index Value)
Market momentum and volume serve as gauges of market greed. This metric examines the current volume and momentum of the Bitcoin market, comparing it to the past 30 and 90-day averages. Heavy volume on the buy side during a market rise generally indicates greed, suggesting that investors are eagerly buying into the market, which can drive prices to volatile levels.
3. Social Media (15% of Index Value)
Social media activity plays a crucial role in the modern investment landscape. This metric analyzes engagement rates on platforms like Twitter, Reddit, and others, focusing on the volume of posts, likes, and related hashtags. High levels of social media activity around a particular cryptocurrency can signal growing public interest and often correspond to greedy market behavior.
4. Dominance (10% of Index Value)
Dominance measures the market capitalization that Bitcoin commands relative to the entire cryptocurrency market. When Bitcoin’s dominance grows, it often indicates a flight to safety, with investors moving away from more speculative altcoins. Conversely, a decline in Bitcoin’s dominance suggests that investors are more willing to take risks on altcoins, driven by a thirst for higher returns.
5. Trends (10% of Index Value)
Trends measure the volume of Bitcoin searches on Google and other search engines. High search volumes are often associated with extreme market conditions. For example, an increase in search queries related to Bitcoin price manipulation has historically preceded significant price drops, indicating rising market fear.
6. Surveys (15% of Index Value)
Surveys provide a direct measure of investor sentiment. This metric is based on weekly surveys conducted on various platforms, where participants are asked about their outlook on the cryptocurrency market. The aggregated scores contribute to the overall Fear and Greed Index score.
Interpreting the Fear and Greed Index
The Fear and Greed Index produces a score between 0 and 100, with specific ranges indicating different market sentiments:
- Extreme Fear (0–24): Indicates very pessimistic investor sentiment, often leading to oversold conditions. This may represent a buying opportunity as prices could be undervalued due to widespread fear.
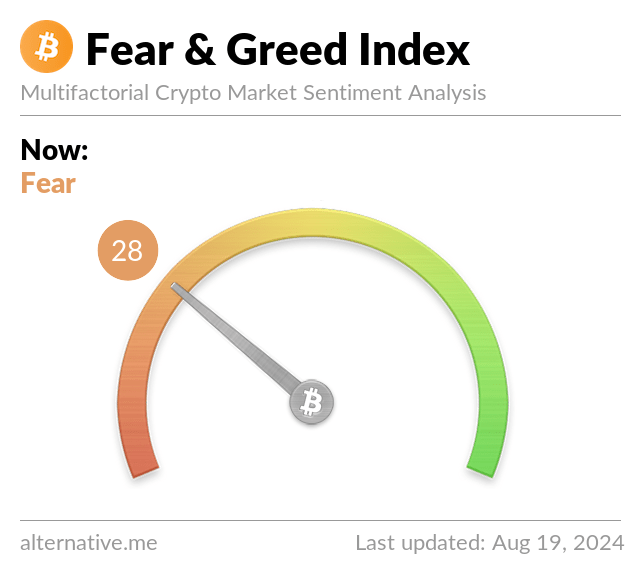
- Fear (25–49): Reflects a general sense of caution in the market. Prices may have dropped, but sentiment hasn’t reached panic levels.
- Neutral (50): Suggests a balanced market without strong emotions dominating investor behavior.
- Greed (51–74): Indicates growing optimism, which could drive prices higher but also warns of an overheated market.
- Extreme Greed (75–100): Signifies that the market is likely overbought, with prices potentially inflated due to excessive optimism, signaling a possible market correction.
Using the Fear and Greed Index in Investment Strategies
While the Fear and Greed Index is a valuable tool for gauging market sentiment, it should not be used in isolation for making investment decisions. Instead, it should be part of a broader strategy that includes technical analysis, fundamental analysis, and other market indicators. For instance, a high score on the Fear and Greed Index may suggest it’s a good time to sell as the market could be nearing a correction. Conversely, a low score may indicate a buying opportunity as prices may have dropped due to excessive fear. However, these signals should be confirmed by other data points to ensure a balanced decision-making process.
Limitations of the Fear and Greed Index
Despite its usefulness, the Fear and Greed Index is not infallible. It primarily measures sentiment, which can be very volatile and subject to sudden changes. Moreover, the index doesn’t account for external factors that might affect the market, such as regulatory changes, macroeconomic trends, or technological advancements. Additionally, the index’s reliance on social media and search trends means it can be vulnerable to manipulation. For instance, a concerted effort to flood social media with positive or negative sentiment can artificially inflate or deflate the index, leading to misleading signals.
The Evolution and Adaptation of the Fear and Greed Index in Cryptocurrencies
The Fear and Greed Index, initially created for the traditional stock market by CNN Money, has undergone significant adaptation to meet the unique demands of the cryptocurrency market. As the cryptocurrency market matured, the need for a similar tool became apparent. Alternative. I adapted CNN Money’s methodology to create a version of the Fear and Greed Index tailored specifically to Bitcoin and the broader cryptocurrency market.
Unlike the stock market, where fundamentals such as earnings reports and economic indicators play a major role, the cryptocurrency market is heavily influenced by factors like social media activity, cryptocurrency dominance, and market trends. These unique elements are included in the new index, making it more relevant and effective for cryptocurrency investors.
Conclusion
The Fear and Greed Index is a useful tool for understanding the emotional factors behind cryptocurrency market movements. By providing insights into market sentiment, it can help investors make more informed decisions. However, it should not be relied upon exclusively. A comprehensive investment strategy should include a mix of sentiment analysis, technical analysis, and fundamental analysis to navigate the volatile world of cryptocurrencies. As always, keeping a calm and balanced approach will serve investors better, especially in extreme market conditions.